The Basins
The Mississippi River Report Card was built by painstaking analysis of data for each goal in each basin.The Mississippi River Report Card was the result of thorough analysis of data for each goal in each basin.
Data and analysis methods were relentlessly reviewed by a dedicated group of researchers. Results were achieved by comparing current conditions to past grades and relevant targets. The overall grade for the watershed – a C- in 2020 – is the result of the average rating of the six major basins comprising the Mississippi River Watershed.
Click on the map below to explore grades for each of the basins.
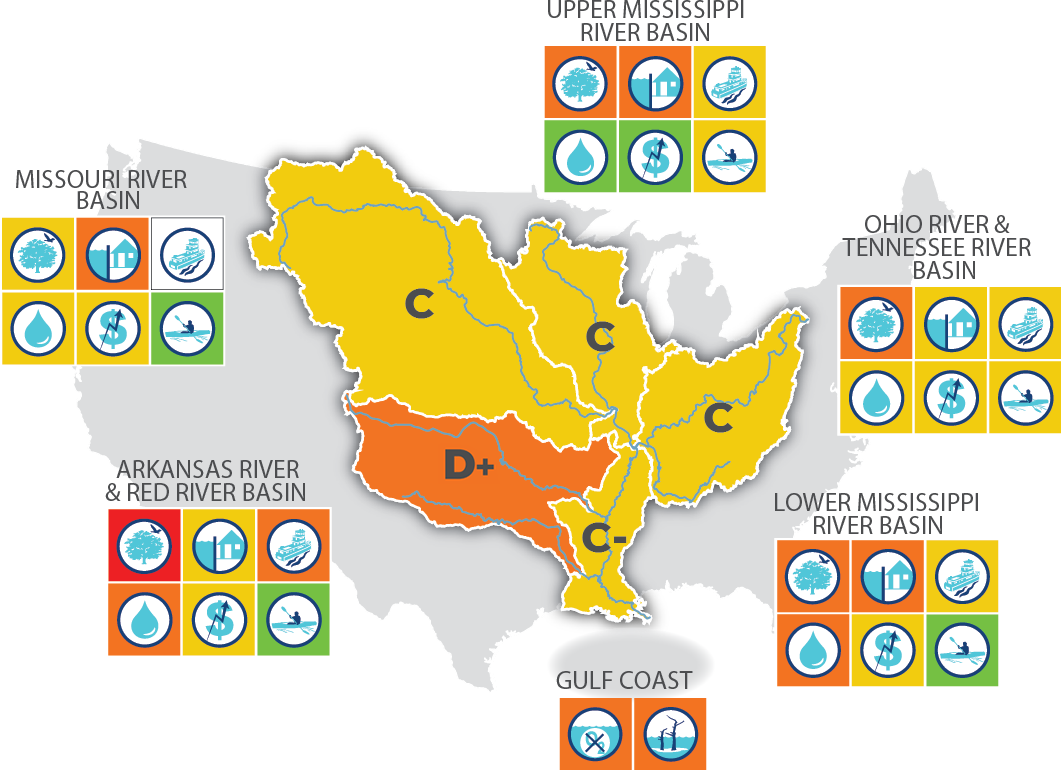
Missouri River Basin

QUICK LOOK: Improved scores for Freshwater Wetland, but has increasing trends in frequency of floods. Levee Condition is poor and Per Capita Income is relatively low in the region.

![]() Water Quality & Ecosystems: C
Water Quality & Ecosystems: C
![]() Flood Risk & Management: D+
Flood Risk & Management: D+
![]() Transportation: Data not available
Transportation: Data not available
![]() Water Supply: C
Water Supply: C
![]() Economy: C
Economy: C
![]() Recreation: B-
Recreation: B-
Upper Mississippi River Basin
QUICK LOOK: Water quality is poor, as a result of high nutrient runoff from regional agriculture. Frequency of floods is increasing, likely a result of rainfall increases and drainage modifications. Lock delays remained low when compared to historical data, reflecting ongoing maintenance efforts to keep
old infrastructure operational.

![]() Water Quality & Ecosystems: D+
Water Quality & Ecosystems: D+
![]() Flood Risk & Management: D+
Flood Risk & Management: D+
![]() Transportation: C
Transportation: C
![]() Water Supply: B-
Water Supply: B-
![]() Economy: B-
Economy: B-
![]() Recreation: C+
Recreation: C+
Ohio River & Tennessee River Basin
QUICK LOOK: Conditions are driven by high nutrient inputs, increasing frequency of floods, and improvements in infrastructure. Per Capita Income is relatively low in some areas.

![]() Water Quality & Ecosystems: D+
Water Quality & Ecosystems: D+
![]() Flood Risk & Management: C
Flood Risk & Management: C
![]() Transportation: C
Transportation: C
![]() Water Supply: C
Water Supply: C
![]() Economy: C+
Economy: C+
![]() Recreation: C
Recreation: C
Arkansas River & Red River Basin

QUICK LOOK: Poor scores for Freshwater Wetland, Levee Condition, Lock Delays, Treatment Violations, and Per Capita Income result in a low overall score for the basin. Although the average age of locks is the lowest of all basins, they still need rehabilitation.

![]() Water Quality & Ecosystems: F
Water Quality & Ecosystems: F
![]() Flood Risk & Management: C-
Flood Risk & Management: C-
![]() Transportation: D
Transportation: D
![]() Water Supply: D+
Water Supply: D+
![]() Economy: C
Economy: C
![]() Recreation: B-
Recreation: B-
Lower Mississippi River Basin

QUICK LOOK: Affected by all the basins upriver, nutrient loads are high, but Flood Frequency scores are good, especially in the tributaries and streams. Transportation scores improved with increased funding for dredging and infrastructure maintenance.

![]() Water Quality & Ecosystems: D
Water Quality & Ecosystems: D
![]() Flood Risk & Management: D
Flood Risk & Management: D
![]() Transportation: C+
Transportation: C+
![]() Water Supply: D
Water Supply: D
![]() Economy: C-
Economy: C-
![]() Recreation: B-
Recreation: B-
Gulf Coast

QUICK LOOK: The average size of the Gulf Dead Zone since 2015 is still almost three times as large as the Gulf Hypoxia Task Force target, and the historical loss of coastal land in Louisiana is an ongoing issue despite efforts to rebuild it.

 Gulf “Dead Zone” Size: D-
 Coastal Wetland: D