
GOAL: Maintain supply of abundant clean water.
GRADE: C-
![]() Ensure the quality and quantity of water in the Mississippi River Watershed is adequate to support the economic, social and environmental functions that are dependent on it.
Ensure the quality and quantity of water in the Mississippi River Watershed is adequate to support the economic, social and environmental functions that are dependent on it.
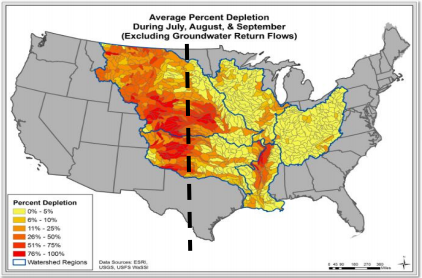
Values of the water depletion index used to score the water depletion indicator. High values indicate areas where human activities consume water at nearly the rate that supplies are renewed. The dashed line is the 100th meridian, which marks the transition between low precipitation to the west and wetter conditions in the east.
People and communities throughout the watershed value clean and abundant water for many uses, including drinking water, supplies for farms and industry, recreation and natural systems. The issues related to water quality and supply are complex, often controversial and vary among the different basins and regions of the watershed. Demand for surface and groundwater throughout the nation is rapidly growing as populations increase and more water is needed to grow crops and support industry. These growing demands, combined with an aging water treatment and supply infrastructure, are putting unprecedented pressure on our water resources. In the future, there must be an integrated management approach that assures that our water supplies support society’s needs and opportunities in a balanced manner throughout the watershed.
Related Links
Grades Explained
Entire Mississippi Watershed
The overall Mississippi Watershed received a grade of C- for Water Supply. All five river basins received D or C grades for this goal. The watershed’s grade was a result of low grades it scored across the indicators used to measure water supply, including “water depletion” (grade B-) and “treatment violations” (grade D), which revealed that municipal systems are not performing well throughout the watershed.
Upper Mississippi Basin
The Upper Mississippi Basin received a grade of C+ for Water Supply. The treatment violations indicator in the Upper Mississippi received a C grade, and this was the highest of all basins in the entire watershed. The water depletion indicator received the highest grade of B, a grade this high was also seen in the Ohio & Tennessee River Basin.
Ohio & Tennessee River Basin
The Ohio River Basin received a grade of C+ for Water Supply. The treatment violations indicator in the Ohio Basin received a D grade. The water depletion indicator received the highest grade of B, a grade this high was also seen in the Upper Mississippi River Basin.
Lower Mississippi Basin
The Lower Mississippi Basin received a grade of D for Water Supply. The treatment violations indicator in the Lower Mississippi received an F grade, one of two basins with failing grades. The water depletion indicator received a C+ grade.
Arkansas River & Red River Basin
The Arkansas River & Red River Basin received a grade of D for Water supply. The treatment violations indicator in the Arkansas River & Red River Basin received an F grade, one of two basins with this grade. The water depletion indicator received a C-grade.
Missouri River Basin
The Missouri Basin received a grade of D for Water Supply. The treatment violations indicator in the Missouri Basin received a D grade while the water depletion indicator received a D+ grade, making it the basin facing the most pressing water supply concerns.
What was measured and how it was evaluated
To determine a grade for the Water Supply goal, the Report Card measured the safety of municipal water supplies as well as the quantity of surface water during peak demand months across the Watershed.
- The Treatment Violations indicator measured violations by community water treatment systems reported to the U.S. Environmental Protection Agency (EPA) and was calculated as the percent of the population served by community water systems with no reported violations in 2013. States with 99% or more of their population served by water supply systems without violations received an A grade, and states with 96% or less of its population served by water treatment facilities without treatment violations were considered failing. The scores for the basins and watershed are weighted to reflect the population served by the systems.
- The Water Depletion indicator graded the quantity of available surface water using a water stress index, based on the U.S. Forest Service Water Supply Stress Index (WaSSi) model. The grade was calculated based on the average depletion index for the peak demand months of July, August and September in the smaller areas—defined as HUC08 units—that are based on smaller rivers and watersheds located in each basin. The scores were compared to the index for all similar units in the contiguous 48 U.S. states. Scores for the basins and entire watershed were then weighted based on the area.
Additional Discussion
The Mississippi River Watershed is bisected by the 100th meridian, dividing the low precipitation areas to the west from the higher precipitation conditions in the eastern parts of the watershed. Both the Missouri River and the Arkansas and Red River basins are bisected by the 100th meridian, and detailed results for the water scarcity indicator clearly show how this affects these basins.
The issue of officially reported water suitability using US EPA 305 (b) data and groundwater use and availability were also suggested and considered for the Report Card. Data unreliability and unavailability prevented their inclusion in this version of the Report Card. It is hoped that these data will be included in future versions of the Report Card.
The AWI Report Card was developed over two years with significant amount of information and feedback from hundreds of experts and stakeholders throughout the watershed and nation. View a comprehensive Report Card technical paper that includes data sources, calculations and analysis.