
Gulf of Mexico “Dead Zone” Size Indicator
The hypoxic zone in the Gulf of Mexico forms every summer because of excess nutrients from throughout the watershed delivered to the Gulf by the Mississippi River and seasonal reduced mixing of waters in the Gulf. Nutrients (primarily nitrogen) from farms, urban areas, and wastewater enters streams and rivers through stormwater runoff. Fertilizers applied to crops and lawns and treated and un-treated wastewater are common sources of nitrogen. These nutrients fuel the growth of algae. When the algae die and decompose, oxygen dissolved in the water is depleted, which creates a large area of low oxygen (hypoxic) water. This area is popularly referred to as a “dead zone” because the lack of oxygen in the water prevents most animals from living there. Reducing nutrients in runoff and wastewater in the watershed will reduce the size of the algae bloom and the subsequent area of the dead zone.
The size of the hypoxic zone is measured every summer and is an important indicator of how much progress is being made to reduce nutrient inputs into the Gulf of Mexico. The size of the zone is also influenced by other factors, such as droughts or hurricanes that can reduce the size of the zone, or floods that can increase the size.
The Mississippi River/Gulf of Mexico Watershed Nutrient (Hypoxia) Task Force was created with participation from the federal, state and tribal governments active in the Mississippi Watershed to coordinate activities to reduce the size of the Dead Zone in the Gulf of Mexico.
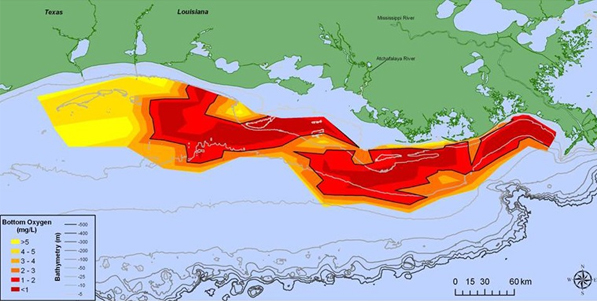
Distribution of bottom-water dissolved oxygen July 28-August 3, 2015 (west of the Mississippi River delta). Black line indicates dissolved oxygen level of 2 mg/L. [1]
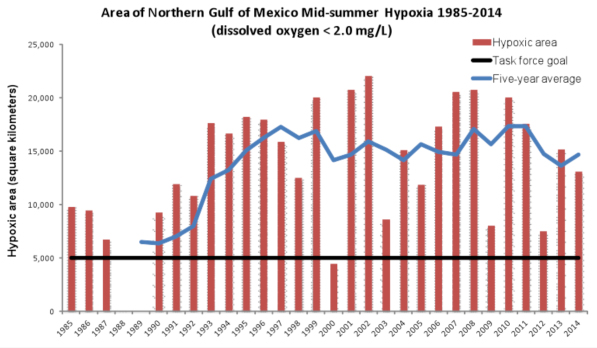
Annual extent of Gulf of Mexico “Dead Zone” and restoration goal set by the Hypoxia Task Force. The dead zone in 2014 was 13,000 square kilometers in area, two and half times higher than the target of 5,000 square kilometers, which earns a score of 28 and a D grade.
Grade
The Gulf Dead Zone Size Indicator received a grade of D in the Report Card.
What was measured and how evaluated
The Gulf “Dead Zone” Size indicator measures the size of the dead zone against the official target of no more than 5000 square kilometers established by the Hypoxia Task Force. Scoring is based on a set of thresholds recommended by the expert hypoxia panel; <1,000 square kilometers = A, <5,000 square kilometers = B, <10,000 square kilometers = C, <15,000 square kilometers = D, and >15,000 square kilometers = F.
Additional Information
The Mississippi River/Gulf of Mexico Nutrient (Hypoxia) Task Force–also called the “Hypoxia Task Force”–was established in the fall of 1997 to understand the causes and effects of eutrophication in the Gulf of Mexico; coordinate activities to reduce the size, severity, and duration; and ameliorate the effects of hypoxia. Activities include coordinating and supporting nutrient management activities from all sources, restoring habitats to trap and assimilate nutrients, and supporting other hypoxia related activities in the Mississippi River and Gulf of Mexico watersheds. The Task Force includes federal and state agencies and the tribes. Federal agencies include those with responsibilities over activities in the Mississippi River and its basin, and in the Gulf of Mexico. The role of the Task Force is to provide executive level direction and support for coordinating the actions of participating organizations working on nutrient management within the Mississippi River/Gulf of Mexico Watershed. The Task Force has designated members of a Coordinating Committee, and solicits information from interested stakeholders.
Coastal Wetlands
Coastal wetlands in Louisiana at the delta of the Mississippi River are rich in plants and animals, provide critical storm protection for coastal communities, are the nursery for the commercial seafood industry and are a culturally unique area with hundreds of years of rich history. At the southern point on the Mississippi River flyway, these coastal wetlands provide wintering habitat for millions of ducks and waterfowl and critical habitat for other species on their seasonal journeys each year. Louisiana’s wetlands extend as far as 80 miles (130 km) inland and along the coast for about 185 miles (300 km). Louisiana’s wetlands today represent about 40 percent of the wetlands of the continental United States, but about 80 percent of the nation’s wetland losses. According to the U.S. Geological Survey, about 75 square kilometers of Louisiana’s 3 million acres of wetlands are lost annually, and reducing these losses is challenging and costly.
However, not all the wetlands are receding; in fact some wetlands are stable, and others are actually growing. Inputs of sediment allow existing coastal wetlands to maintain elevation relative to sea level rise and create new wetland area to balance losses from erosion. Construction of reservoirs along the Mississippi River and its tributaries during the 20th century has reduced the amount of sediment carried by the river from historical amounts. Channelizing the river and constructing levees to control flooding along the Lower Mississippi River drastically reduces the amount of the remaining sediment that is delivered to coastal wetlands. Most of the sediment carried to the Gulf of Mexico through the Lower Mississippi River is washed out through the river mouth in the Bird’s-foot Delta and deposited in deep water, where it is no longer available to nourish coastal wetlands. This situation follows engineering efforts to maintain high water velocities through the shipping canal.
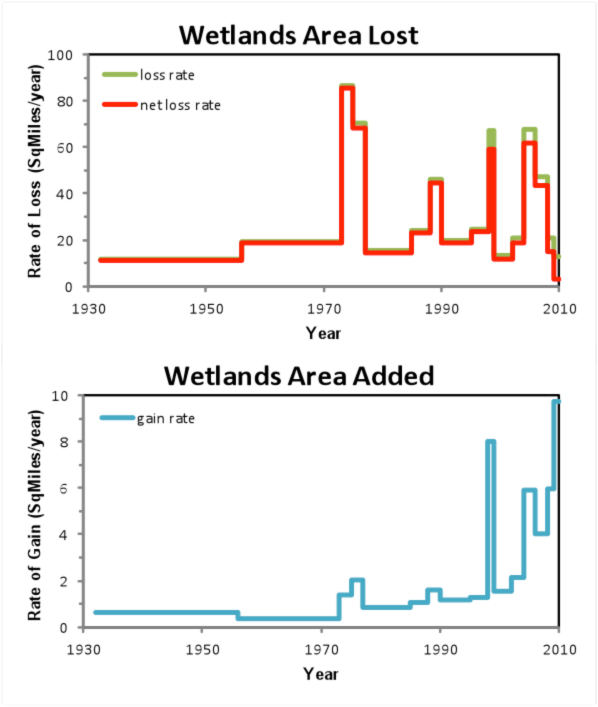
Figure E.1: Rates of historical wetlands loss, wetlands gain and the net loss rate based on data in Couvillion et al. (2011).[2]
Grade
The Coastal Wetland Indicator received a grade of D in the Report Card.
What was measured and how evaluated
The Coastal Wetlands indicator measures the annual net rate of wetland loss in coastal Louisiana, the delta region of the Mississippi River and wetlands of the Chenier Plain that depend on water and sediment discharged by the river. The area of wetlands in coastal Louisiana has declined consistently since the 1930s. The score is calculated based on the net rate of wetland loss in recent years compared to historical loss rates. The rate at which wetland area is being lost each year has decreased from historically high rates, but the net loss of wetlands continues.
No net loss of wetlands, yet no recovery would earn a C grade. The area must show a net gain in wetland area to score better than a C grade. (Read an article about how sediment recycling can help mitigate wetlands loss.)
Additional Information
The rate at which new coastal wetland area is being added is increasing; wetland area is being added at the outlet of the Atchafalaya River, a distributary of the Mississippi that delivers sediment to shallow, inshore waters. Other efforts to recycle materials dredged from the shipping channel to create wetland areas have also proven successful. If these trends continue, the overall balance soon could shift to a net increase in wetland area. However, expected increases in the rate of global sea level rise and continuing land subsidence (natural and historic land elevation decline) threaten to increase the rate of loss of wetland area. (Read an article about how sediment recycling can help mitigate wetlands loss.)
[1]- Data: Nancy R. Rabalais, LUMCON, and R. Eugene Turner, LSU. Credit: NOAA. Funding sources: NOAA Center for Sponsored Coastal Ocean Research and U.S. EPA Gulf of Mexico Program
[2] – Table 3 in Couvillion, B.R.; Barras, J.A.; Steyer, G.D.; Sleavin, William; Fischer, Michelle; Beck, Holly; Trahan, Nadine; Griffin, Brad; and Heckman, David, 2011, Land area change in coastal ouisiana from 1932 to 2010: U.S. Geological Survey Scientific Investigations Map 3164, scale 1:265,000, 12 p. pamphlet
The AWI Report Card was developed over two years with significant amount of information and feedback from hundreds of experts and stakeholders throughout the watershed and nation. View a comprehensive Report Card technical paper that includes data sources, calculations and analysis.