Ohio & Tennessee Rivers
The Ohio River and Tennessee River Basins are home to 29 million people and cover parts of 14 states. The landscape is dominated by forests, agriculture, pastures for livestock and major cities. River flow is regulated through a series of locks and dams on the Ohio, Tennessee and Cumberland rivers, helping to make it one of the most important transportation corridors in the United States. The basin is rich in coal, gas and water energy industries. In addition to providing numerous recreational opportunities throughout the basin, at least five million residents receive their drinking water from the Ohio River.
The Ohio River Basin received an average of a C grade for the six goals. This basin has had an increase in wetland areas, had high employment in river dependent industries compared to the national average, experienced low delays at locks, and has relatively low water stress. However, the basin also had declining participation in outdoor activities and hunting and fishing licenses. It also has poor infrastructure condition and maintenance, and nearly 3 percent of water supply systems reported violations.
Because the Ohio River Basin is in the high rainfall area of the northeastern United States, it supplies most of the water flow to the Mississippi River system. The Ohio River Basin, including the Tennessee and Cumberland rivers, is an important transportation corridor for the industrial eastern United States and a source of abundant hydropower. The low scores for transportation infrastructure and maintenance warn of catastrophic failures, which could have substantial negative impacts to industry here. The high population and industrial uses may contribute to relatively low water quality in this basin.
Related Links
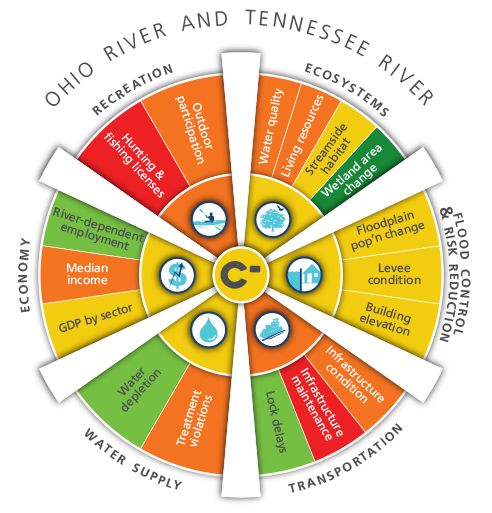


Grades Explained by Goal
Ecosystems
The Ohio River Basin received a grade of C for Ecosystems. The Living Resources indicator received a D+ and the Streamside Habitat indicator received a C. The Water Quality indicator in the Ohio received a D+ while the Wetland Area change indicator received an A grade, one of only two basins with this highest grade.
Flood Control & Risk Reduction
The Ohio River Basin received a grade of C- for Flood Control & Risk Reduction. The Floodplain Population Change indicator in the Ohio Basin received a C- grade. The Levee Condition indicator received a C grade and the Building Elevation indicator received a C- grade.
Transportation
The Ohio River Basin received a grade for D Transportation. The Infrastructure Condition indicator received a Failing grade. The Infrastructure Maintenance indicator received an F for the entire watershed. The Lock Delays indicator in the Ohio River received a B grade.
Water Supply
The Ohio River Basin received a grade of C+ for Water Supply. The Treatment Violations indicator in the Ohio Basin received a D grade. The Water Depletion indicator received the highest grade of B, a grade this high was also seen in the Upper Mississippi River Basin.
Economy
The Ohio River Basin received an overall grade of C for Economy. The River Dependent Employment indicator in the Upper Mississippi received a B grade, the highest in the watershed. The Median Income indicator received a D+ grade. The GDP by Sector indicator received a C grade.
Recreation
The Ohio River Basin received a grade of D for Recreation. The Outdoor Participation indicator received a D grade and the Hunting and Fishing licenses indicator received a Failing grade.
The AWI Report Card was developed over two years with significant amount of information and feedback from hundreds of experts and stakeholders throughout the watershed and nation. View a comprehensive Report Card technical paper that includes data sources, calculations and analysis.