Drought and low water on the Mississippi River don’t just affect the communities along its banks — they ripple across the entire watershed’s economy, from barge traffic and agriculture to municipal water supplies and public health. Making sense of that risk requires timely, trustworthy information. The Mississippi River Drought & Water Dashboard was created to help meet that need.
Bringing Drought Information Together
The Mississippi River Drought & Water Dashboard is an interactive online platform that brings together drought and water information from across federal and state agencies. It was designed to help state, Tribal, and local governments, nonprofits, and other users better understand drought and low water conditions and their potential impacts.
The Dashboard allows users to:
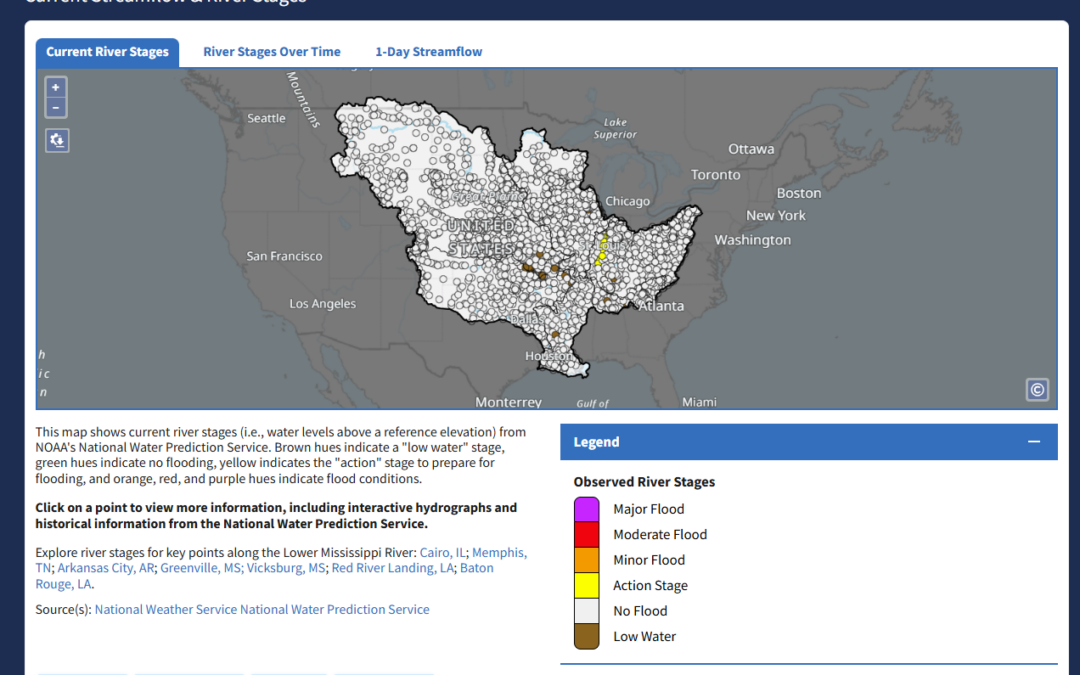
- Check current conditions at a glance, including real-time river stages, streamflow, and drought data.
- Explore the watershed at different scales, from the entire Mississippi River Watershed to individual HUC 2 and HUC 8 scale.
- Download ready-to-use graphics, including high-quality maps for briefings, newsletters, reports, and other communications.
- Learn more about drought and low water, with educational resources focused specifically on the Lower Mississippi River.
America’s Watershed Initiative recently hosted a 30-minute webinar featuring NIDIS’s Molly Woloszyn, who walks through the Dashboard’s features and demonstrates how users can put them to work. Watch the webinar recording here to learn more.
From Data to Action
The Dashboard was developed collaboratively with federal, state, and local partners, including the National Weather Service, U.S. Army Corps of Engineers, U.S. Coast Guard, U.S. Geological Survey, state climate offices and departments of natural resources, and industry organizations.
NIDIS also hosted listening sessions and conversations with drought information producers and users throughout the watershed to better understand what information people need and how they use it.
The result is a tool designed not just to provide more data, but to make existing information easier to find, understand, and use. The Dashboard:
- Brings information together in one place, reducing the need to search across multiple federal and state websites to understand drought and water conditions.
- Makes data easier to visualize and share, with customizable maps that can be downloaded for reports, presentations, and planning.
- Provides regional context, including educational resources about drought and low water impacts in the Lower Mississippi River.
- Connects users to key water information, including river stages from the National Water Prediction Service and comparative hydrographs from the U.S. Army Corps of Engineers.
By bringing together information from across agencies and making it easier to interpret and communicate, the Dashboard can help communities and decision-makers better understand drought risk and prepare for its impacts.